What’s Going On in This Graph?
An example of how the ASA is working to improve K–12 Statistics Education
What do you notice about this graph? What do you wonder?
These are two questions students are asked to answer as part of the weekly What’s Going On in This Graph? (WGOITG) feature of the New York Times Learning Network.
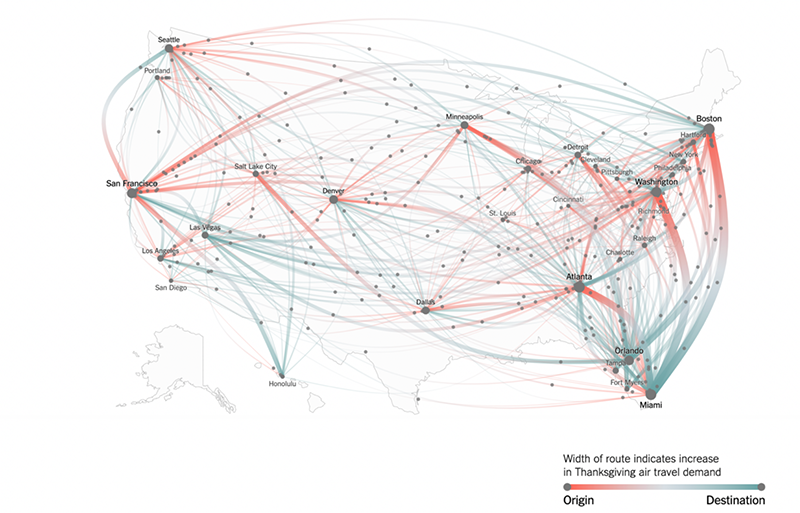
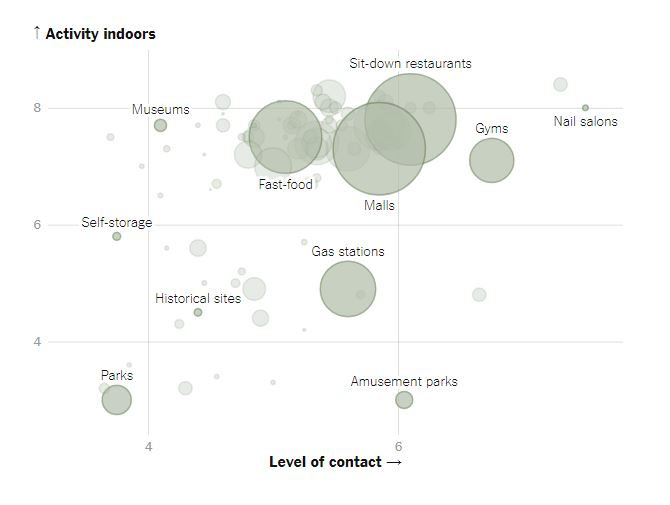
Since September of 2018, the ASA has partnered with the New York Times Learning Network to bring WGOITG to students and teachers free of charge each week. It is designed to be accessible to all, regardless of mathematical background. The goal is to help youth better understand and critically interpret graphs that relate to the world they live in. Topics range from the cost of engagement rings and missing buses to crime by immigrants and teenagers’ sports injuries and mental health. There have also been features about COVID-19 and flattening the curve.
“WGOITG has grown from nine releases to 32 releases per year,” says Sharon Hessney, head moderator of WGOITG. The number of student responses has grown from about 3,000 in 2018 to almost 13,000 during this past year.”
However, 13,000 does not reflect all the students who engage with the graphs; it only reflects those who respond online. “The number of students engaged with these graphs may be 50 times the response number,” says Hessney.
Especially with the COVID environment and distance learning being in place across much of the country, teachers are looking for programs like WGOITG to engage their students. And not just math teachers. Science, English, and social studies teachers also attended a June webinar about using WGOITG in the classroom.
Lindsey Kotz, a middle-school teacher in Tucson, Arizona, used the weekly graph feature as a warm-up routine for her eighth-grade math and algebra students. Once they moved to distance learning, she used Zoom breakout rooms to promote discussion in smaller groups before coming back together as a whole class to talk about the graphs.
“This feature gets students critically thinking and understanding deeper what we are talking about and how math relates to the real world,” says Kotz.
Middle-school teacher Kathleen Logan says, “I have used [WGOITG] in a suburban middle-school science class, as well as an inner-city high-school science class. The relatable graphs pique students’ interest and generate lively conversations while [allowing me to teach] about independent/dependent variables and types of graphs.”
I have especially seen a transformation in disengaged and struggling students, who find this real and interesting and something they can find success in,” continues Logan. “When students are arguing about how data should be displayed and critiquing these graphs, learning is happening! Thank you for this initiative.”
Sharon adds, “This program entices teachers and students to engage with graphs. Then, once engaged, they improve their ability to tease out the graphs’ stories. Each week’s release provides more surprises about the world they live in. This skill and interest should continue for a lifetime. You could compare ‘reading’ graphs to reading poetry. All graphs (and poems) are different. The more you read, the better you get at understanding and appreciating them.”
To see more of the graphs featured in the WGOITG program, visit The New York Times.